Two Google Search Console exports sat in a folder for three weeks before anyone compared them. When they finally lined up Q1 2025 against Q1 2024, one product-category page had lost 186 clicks across 26 queries — and average position had barely moved. The rankings looked fine. The revenue didn’t.
That gap between “rankings look fine” and “revenue is down” is what a click gap audit exists to catch. It takes two fixed windows of GSC data, calculates the click delta for every query and every page, and sorts the result into buckets you can act on. Not a ranking report. A decision list: which pages to fix first, which queries to reinvest in, and which losses are structural failures that compound if you leave them.
- Sale!


SEO Content Audit
Original price was: 1999,00 €.1799,00 €Current price is: 1799,00 €. Select options - Sale!
Search Rankings and Traffic Losses Audit
Original price was: 3500,00 €.2999,00 €Current price is: 2999,00 €. Select options - Sale!
Full-Scale Professional SEO Audit
Original price was: 5299,00 €.4999,00 €Current price is: 4999,00 €. Select options
Most performance monitoring watches average position and calls it done. Average position is a lagging, blended metric that hides exactly the pages you need to find. A page can hold position 4, keep its impressions, and still lose two-thirds of its clicks to an AI Overview sitting above it. The click gap audit is built to surface that page while the loss is still recoverable.
What a Click Gap Audit Measures
A click gap audit compares two equivalent, fixed periods — the same quarter year-over-year — across four Search Console dimensions: clicks, impressions, CTR, and average position. For every query and every page, it calculates the delta between the two periods and classifies that delta into a bucket that maps to a specific fix.
The year-over-year framing carries the whole method. Compare consecutive quarters and seasonality contaminates the signal. A retailer stacking Q4 against Q3 will see clicks fall on most categories because Q3 was the slow season — nothing to do with SEO. Stack Q4 2025 against Q4 2024 and seasonal demand cancels out, leaving structural performance change as the thing you’re actually looking at. If the site went through a migration, a CMS change, or an internal-linking rebuild, run the audit right after the change and again 60 to 90 days later, so the comparison isolates the impact of that specific event.
The audit reads across three data layers. Query-level click gap tells you which search terms send more or fewer clicks than the same period last year — the most precise diagnostic in the whole method. Page-level click gap aggregates those query deltas to the URL, which catches the page that’s gaining on branded terms while quietly bleeding its core commercial queries. Crawl-data overlay adds HTTP status, index status, word count, and internal link count from a site crawl, so you can tell a page that lost 115 clicks because it got noindexed apart from a page that lost 115 clicks with no technical cause at all. The first is a two-minute fix. The second is a content and authority problem.
The Click Gap Patterns That Signal a Real Problem
A well-built audit sorts queries into buckets. Most of them mean something is wrong, and each one points at a different fix. Reading the bucket correctly is the difference between rewriting a title tag and rebuilding a topical cluster.
Lost clicks with lost impressions is the most serious pattern. Google is surfacing the page less often for that query — declining topical relevance, a ranking drop that pushed the page past the first page, or content that no longer matches the query’s intent. In the dataset that opened this piece, 26 queries fell here and gave up 186 clicks in one quarter. This bucket is never a CTR fix. Check the average position delta first: a shift from 5.3 to 14.7 mechanically explains almost the entire loss, because position 5 earns roughly 7% CTR and position 15 earns closer to 1.5%.
Lost clicks with stable or growing impressions means CTR collapsed. Google still shows the page — fewer people click. In 2026 the dominant cause is SERP-feature encroachment: an AI Overview, a featured snippet, or a local pack absorbing the clicks that used to reach position 3. The second cause is a title or meta description that no longer matches what the query is actually asking. This is the pattern BrightEdge measured across billions of queries: <cite index=”3-1″>impressions on all content rose over 49% since AI Overviews launched, while click-throughs fell nearly 30% since May 2024</cite>. Visibility went up. Clicks went down. Those two facts now move independently, and this bucket is where that shows up on your own site.
Gained clicks with lost impressions is rarer and usually good news — a title or snippet rewrite improved CTR even as raw visibility narrowed. Worth noting, not an emergency.
New queries served captures terms that didn’t appear in the earlier period at all. That’s topical expansion, from a content update or from Google’s improved entity understanding of the page. Queries no longer served is the inverse — terms that were there before and have vanished. If the volume was meaningful, investigate: a page dropped from the index or a redirect that severed topical authority is often the reason.
Data Sources and Setup
A complete audit needs three inputs joined together.
Two GSC performance exports from identical date ranges in different years. Pull them through the Search Analytics for Sheets add-on rather than the web interface — the GSC UI caps exports at 1,000 rows, which quietly truncates the long tail where a lot of the loss hides. Export query-level data with clicks, impressions, CTR, and position for each period separately.
A full site crawl through Screaming Frog or an equivalent, with the GSC integration switched on. The crawl populates the diagnostic fields the raw export can’t: HTTP status (catching 404s and redirect chains), indexability (catching noindex directives added by accident), word count (the thin-content correlation), and internal link count (pages dropped from internal linking lose clicks as Google redistributes crawl equity elsewhere).
A merged query list combining every query from both periods, so you can compute the delta and flag terms that appear in only one window. Once the three sources are joined, the calculation per query is plain subtraction: Click Gap = Clicks (current period) − Clicks (prior period). A negative number means clicks declined. The insight comes from reading that number against the impression delta and position delta at the same time — one column alone tells you almost nothing.
Reading the Signals: Query Diagnostics
Query-level analysis produces the most actionable signals, and the diagnosis runs as a short decision tree.
If impressions dropped alongside clicks, the ranking most likely fell — check the average position delta to confirm. A move from 5.3 to 14.7 accounts for the loss on its own, and the fix is content depth plus authority, not a snippet tweak. If impressions held or grew but clicks fell, the problem is CTR: audit the title and meta description against the query, and check whether a SERP feature is eating the click before it reaches you. If a query lost clicks and impressions together while the page stayed indexed, look at internal links and crawl depth — a page that had 651 internal links in one period and far fewer in the next loses both ranking equity and crawl frequency.
Intent decides the response in the CTR bucket. Ahrefs found that <cite index=”20-1″>AI Overviews appear on 99.9% of informational keywords — most of them long-tail, seven words or longer — while transactional and shopping queries trigger them less than 5% of the time</cite>. So a transactional query losing clicks with stable impressions is almost always a snippet or intent-match problem you can fix. An informational query losing clicks in 2026 may be losing them to an AI Overview permanently, and no title rewrite recovers a click the user never intended to make. Classify intent before you spend a day optimizing a page whose clicks left for structural reasons.
Reading the Signals: Page Diagnostics
Page-level analysis catches what query-level misses: a URL gaining on branded and navigational terms while hemorrhaging its core commercial queries. The aggregate looks flat. The cluster underneath is eroding. For any page with a large negative gap, the crawl overlay answers three questions.
Is the page indexed? The GSC URL Inspection API tells you definitively, and “URL is on Google, but has issues” is a different signal from a clean “URL is on Google” — the issues classification correlates with structured-data and mobile-usability failures that suppress the rich results amplifying CTR. Did word count or internal link count change recently? Pages under 500 words struggle to hold authority across a competitive cluster, and pages with fewer than 10 to 15 internal links from relevant hubs are under-resourced on equity. Is the position trend directional? A page sliding from average position 19 to 28 is on a trajectory that compounds — the intervention has to happen now, not after another quarter confirms the decline.
Showing 1–3 of 5 resultsSorted by popularity
- Sale!

White Label SEO Audit
Original price was: 5299,00 €.4999,00 €Current price is: 4999,00 €. Select options - Sale!
SEO Content Audit
Original price was: 1999,00 €.1799,00 €Current price is: 1799,00 €. Select options - Sale!
Search Rankings and Traffic Losses Audit
Original price was: 3500,00 €.2999,00 €Current price is: 2999,00 €. Select options
Actioning the Output: A Priority Framework
The classification feeds straight into a priority list, because not every negative gap is equally worth your time.
High priority: clicks down, impressions strong, page indexable with reasonable word count and links. That’s a CTR opportunity with a short payback — a title or snippet rewrite can recover the clicks inside one comparable period. Medium priority: impressions also declined but the position shift is modest, under five spots. These respond to content depth, structured data, and internal links from higher-authority hubs. Lower priority but not ignored: queries that vanished from GSC entirely. Cross-reference against the crawl — if the page was noindexed, redirected to something unrelated, or stripped of internal links, restoration is usually the path, provided the query still has volume worth recovering.
One category jumps the queue. Any page with a large negative gap whose HTTP status shows anything but 200, or whose index status changed between the two periods, is a structural failure, not an optimization. These compound across a whole topical cluster fast, and they’re the first thing to fix. If you’re staring at a wave of these — losses you can’t attribute to any technical cause you can find — that’s the point where a dedicated Search Rankings and Traffic Losses Audit earns its place, because the diagnosis has moved past what a spreadsheet can settle.
The 2026 Context: AI Overviews and the Decoupling Problem
No click gap audit in 2026 should read a CTR decline in isolation from the SERP itself. AI Overviews have split impressions from clicks in a way that operates independently of page quality. When an Overview appears, the page can log an impression while the click never comes, because the user resolved the query without leaving Google. The Ahrefs team, in a December 2025 study of 300,000 keywords led by Ryan Law and Xibeijia Guan, found the scale of it: <cite index=”18-1″>the presence of an AI Overview reduced click-through rate for the top-ranking result by 58%, meaning roughly 42 of every 100 clicks that once reached the first-ranked page now stay on Google</cite>. Pew Research, tracking real browsing rather than keyword data, reached the same place from a different direction: <cite index=”14-1″>when an AI summary appeared, only 8% of users clicked a traditional result, versus 15% without one — and just 1% clicked a link inside the summary</cite>.
That doesn’t mean the gap is always explainable away. Intent still decides. Transactional queries see limited cannibalization, because the user needs to act, not just read. Informational queries with clean factual answers may have lost those clicks for good, regardless of how well the snippet is written. The practical rule: classify intent before you triage. A transactional query losing clicks with flat impressions demands a snippet response. An informational query losing clicks with rising impressions is probably AI Overview encroachment — and the right move is either to pursue featured-snippet capture (which positions you for citation inside the Overview) or to move content investment toward queries with real conversion intent. Google added AI Overview and AI Mode as separate segments under Search Appearance in the Search Console performance report in 2025, so you can now isolate exactly which pages carry AIO impressions with almost no clicks. That segment is your citation pipeline and your traffic-loss hotspot at the same time.
This is the shift the audit is really tracking. The old scoreboard read positions. The new one reads clicks against impressions against intent, because a number-one ranking under a 1,000-pixel Overview isn’t the asset it was two years ago. Revenue was always the point. Now the metric that protects it is the click gap, not the rank.
Frequently Asked Questions
What’s the difference between a click gap audit and a standard GSC performance review? A standard review reads current data in isolation — where you are, not how you got there or how fast it’s changing. A click gap audit is comparative by design: it quantifies the delta in clicks, impressions, CTR, and position between two equivalent periods. A page holding position 12 with flat clicks is invisible in a snapshot; the same page carrying a −80 click gap over 90 days is a priority in a click gap audit. The delta is where the diagnostic value lives.
Why year-over-year instead of period-over-period? Consecutive-period comparisons inherit seasonality as noise. A site selling outdoor furniture shows large click drops in autumn versus summer for product queries — that’s demand, not decline. Comparing the same quarter across two years cancels seasonal rhythm and isolates structural change, which lets you tell a real ranking loss apart from an expected traffic dip.
How do I handle queries that appear in one period but not the other? Queries present now but absent a year ago are “new queries served” — usually content updates, new coverage, or Google’s expanded entity understanding of the page. Queries that vanished are the higher priority: check whether the page is still indexed, whether its internal link count dropped, and whether the query’s dominant SERP format changed and pushed your page out of relevance.
Which crawl data matters most for diagnosing the cause? Three fields do most of the work: HTTP status (4xx and redirect issues), index status via the URL Inspection API (noindex and coverage problems), and internal link count (equity lost to structural changes). Word count is secondary — thin pages rarely hold click performance across competitive clusters. Structured-data validation errors are worth a look too, since losing rich-result eligibility compresses CTR even when rankings hold. A structured SEO Content Audit folds these signals into the click data so the diagnosis doesn’t stop at “clicks are down.”
How often should the audit run? Quarterly is the floor for any site with meaningful organic traffic. A 90-day window gives enough data for reliable click signals while keeping the output actionable — findings translate straight into the next quarter’s task list. Run it immediately after any migration, CMS change, or internal-linking restructure, then again 60 to 90 days later to measure the structural impact.
Turn the Gap Into a Task List
Export your last two equivalent quarters from Search Console, run the query and page comparison across all four metrics, and map the output onto the buckets above. Most of the value is in that first pass — you’ll know within an hour which losses are two-minute technical fixes and which are cluster-level problems that compound if ignored.
- Sale!
SEO Content Audit
Original price was: 1999,00 €.1799,00 €Current price is: 1799,00 €. Select options - Sale!
Search Rankings and Traffic Losses Audit
Original price was: 3500,00 €.2999,00 €Current price is: 2999,00 €. Select options - Sale!
Full-Scale Professional SEO Audit
Original price was: 5299,00 €.4999,00 €Current price is: 4999,00 €. Select options
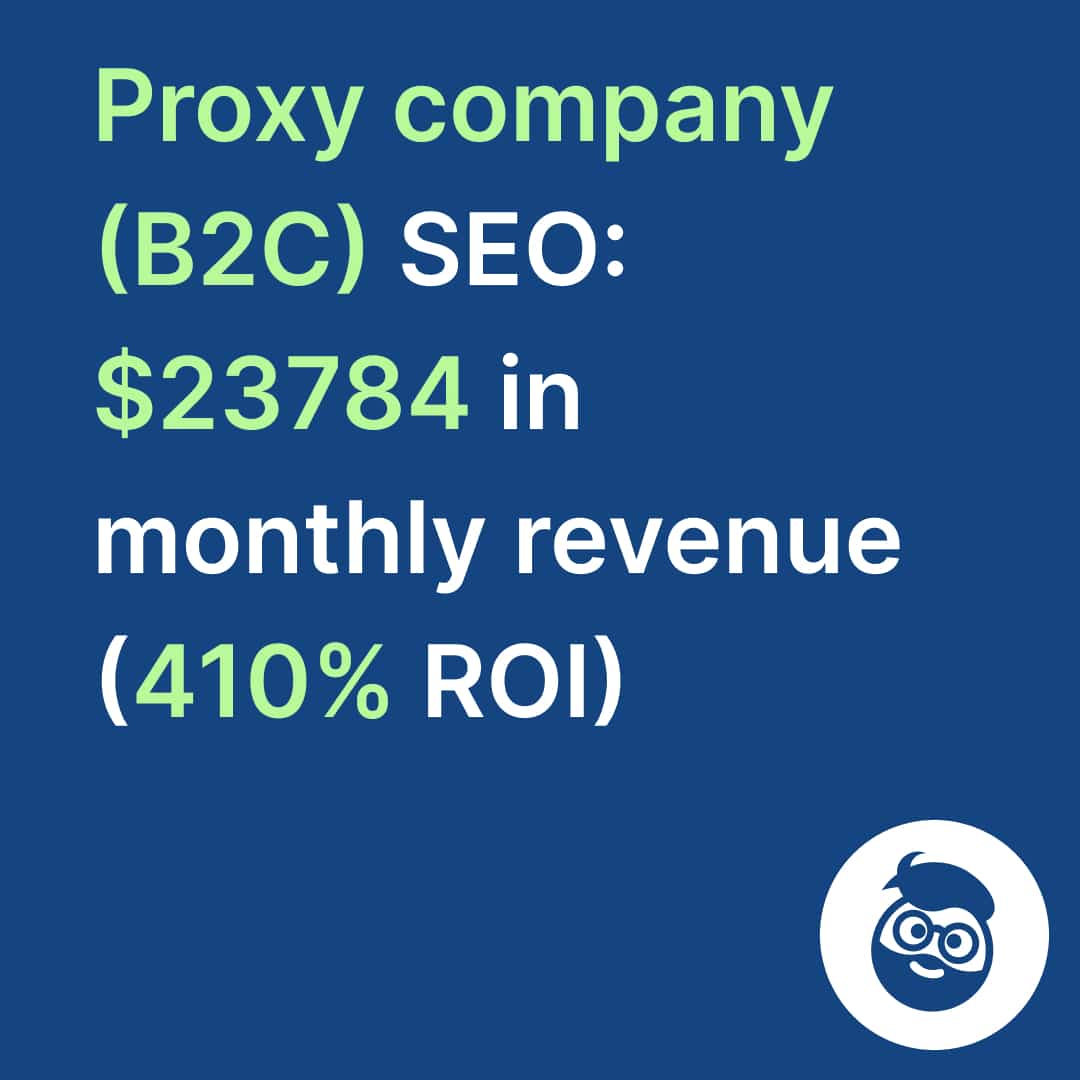
We run this diagnostic as the front end of a full technical SEO campaign, because a click gap is a symptom and the fix is rarely a single page. It’s the same method behind results like a proxy-selling company reaching $23,784 in monthly revenue at 410% ROI — clicks recovered and reallocated toward the queries that actually convert. If your click gap analysis is surfacing structural declines you can’t attribute to a technical cause, talk to the team at SEOBRO.Agency and we’ll run the full diagnostic against your revenue, not your rankings.